Hello, everyone! With aurora season in full swing, I want to kick off a series of blog posts on my favorite aurora-chasing resources. While many others have written great guides on how to use solar wind data, Kp, ground magnetometers, and more, I want to cover some of the lesser-known but perhaps more powerful tools that can really elevate your aurora-chasing game. To start things off, I want to cover the GOES magnetometers - a great resource for those in North America. This pair of satellites can accurately forecast auroral substorms within minutes, and I’m guessing you’ve never heard of them - the reason probably being that the data are not intuitive and need context to properly use.
Substorms and the GOES Magnetometers
But before we go any further, let’s go over what GOES magnetometers are useful for and ease our way into some auroral science. As I mentioned above, the GOES magnetometers (I’ll start calling them “GOES” from now on) are best used to predict when substorms will occur. Substorms are periods (usually 15-30 minutes in duration) of strong auroral activity that spread across the auroral oval, causing the aurora to become intense and expand across the sky with fast motion. The fastest and brightest auroral displays are seen during substorms, so, needless to say, if you’re trying to see a “proper” aurora, what you really want to see is an auroral substorm. On social media, I like to call substorms “aurora explosions'' since within minutes, the aurora can turn from a weak glow into a dancing display that fills the entire sky. This substorm “onset,” as it is called, is a phenomenon in and of itself, and oftentimes, auroral beads on quiet onset arcs herald the beginnings of substorms. Auroral beads and substorm onsets are actually the topic of my Thesis that I am doing for my Ph.D.
In this timelapse below, the substorm is easy to spot - the moment when the aurora goes from a static arc to filling the sky with dynamic streamers, arcs, and swirls. Sometimes, the onset takes minutes, other times, seconds. It can seemingly come out of nowhere, but with GOES, you can learn to predict when they will happen.
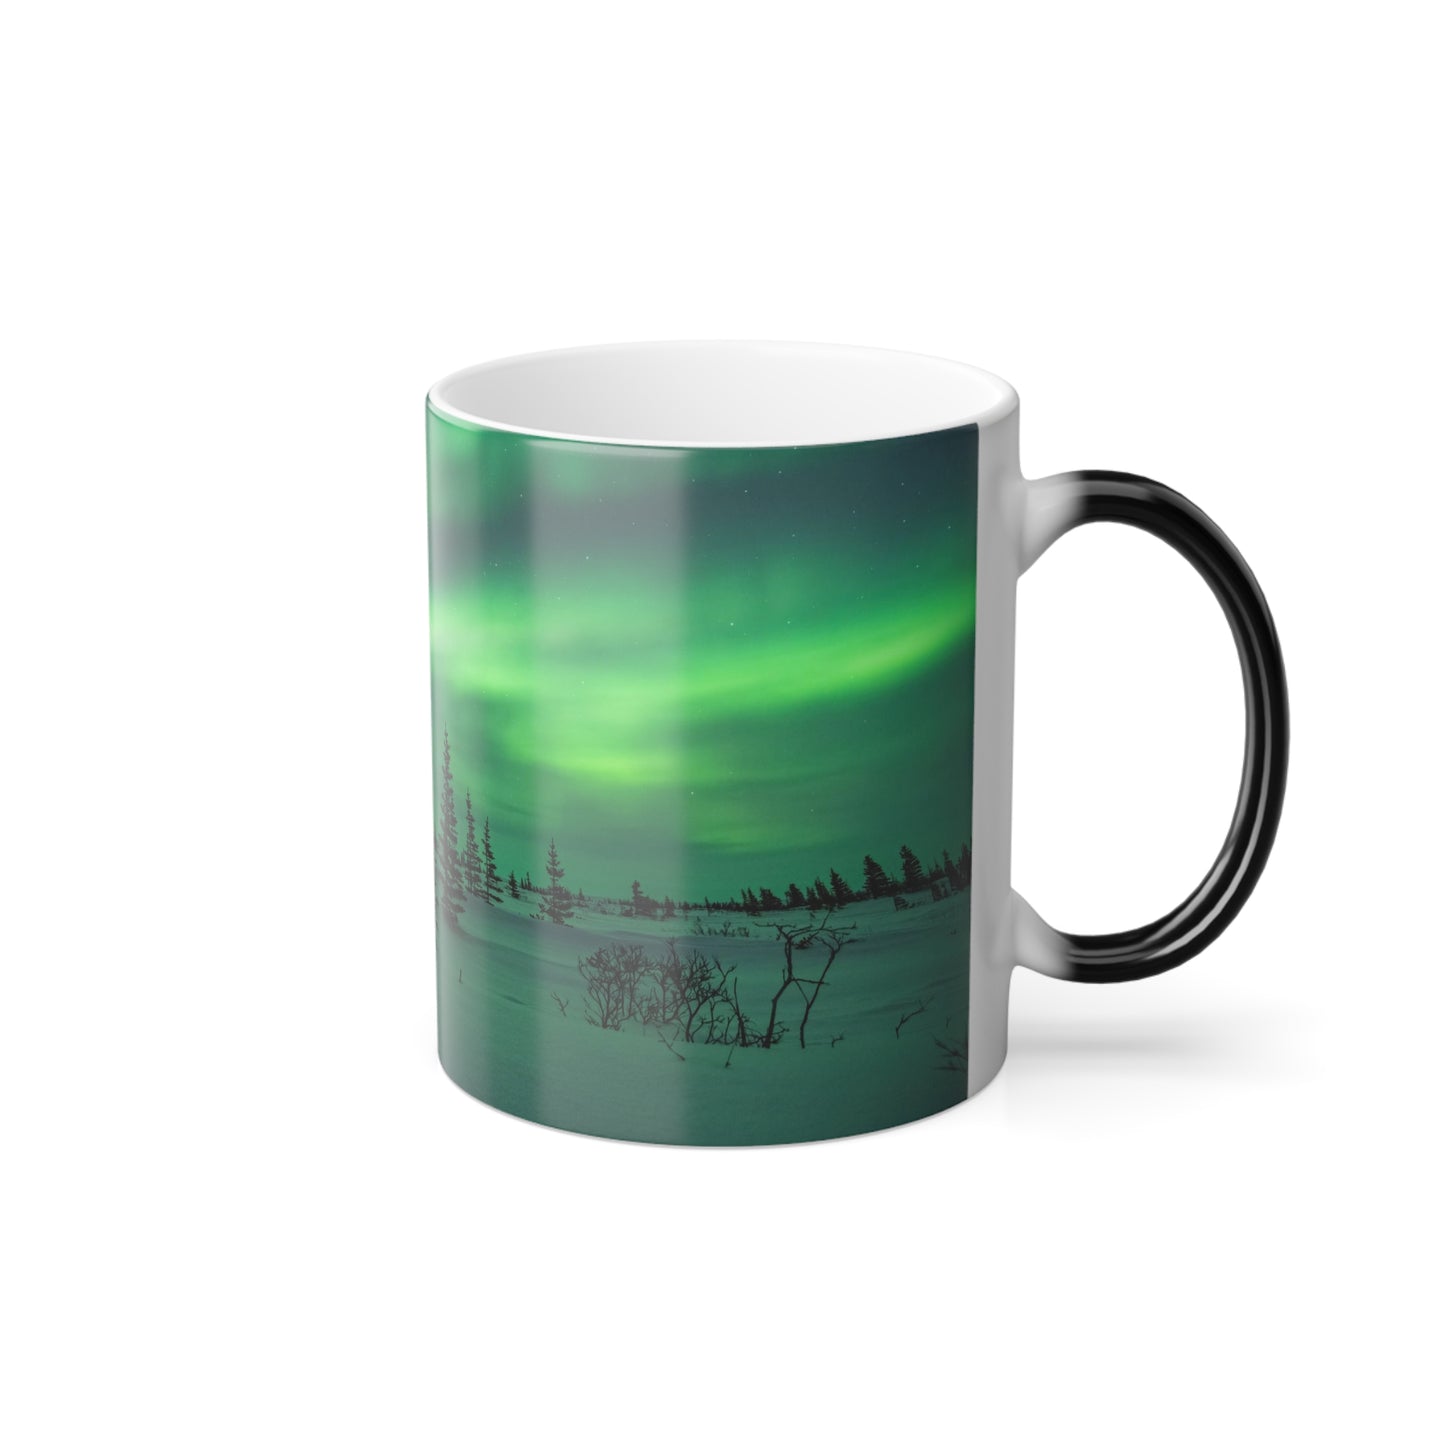
Short timelapse showing the birth of an intense substorm on March 3, 2022 as seen in Fort Yukon, Alaska.
What are substorms?
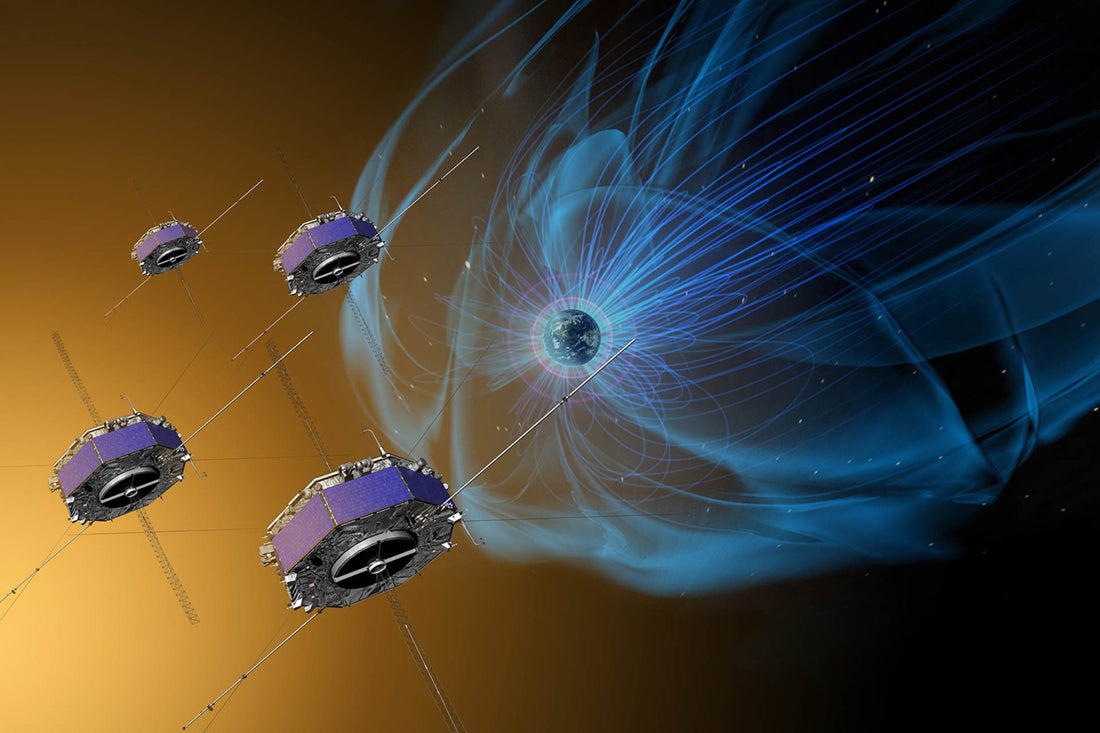
What actually causes a substorm to form? Well, this burst of energy comes from the magnetosphere, the extension of our magnetic field into outer space that protects us from solar radiation and particles and all the other junk in outer space, acting as a sort of shield. that transports energy and charged particles into and out of the near-Earth space environment. It also transports energy and charged particles into and out of the near-Earth space environment and can store and release this energy. The release of this energy from the magnetosphere is almost like a slingshot - over the course of a night, Earth’s magnetosphere stores more and more energy until suddenly it is released into the aurora. Imagine somebody loading a slingshot with a ball of sand or tiny rocks. The sand and rocks are analogous to the charged particles that hit our atmosphere and create aurora. The further back the slingshot is pulled, the more it becomes stretched and the more squished it gets. The potential energy also increases since if you let go after pulling back the sling very far, the projectiles will have more speed and impact than if the sling were let go after just pulling back a little bit. Earth’s magnetosphere is shaped like a teardrop with the slide facing the Sun becoming compressed and the side opposite to the Sun becoming stretched out in a tail - the magnetotail. The magnetotail can become more or less stretched and holds charged particles at its end, just like our slingshot. When the stretched tail “lets go” of these charged particles, it changes from a very elongated tail shape to more of a rounded shape. This process is called dipolarization. These charged particles then accelerate along magnetic field lines down towards the north and south geomagnetic poles on Earth’s nightside, causing an intense burst of auroral activity which we call a substorm. I have heavily simplified this process so that you can understand it, but it is well known in the scientific community. I’ll link several papers describing the substorm process at the end of this post. The NASA visualization below shows this process in action:
NASA SVS animation of a substorm caused by magnetic reconnection in Earth's magnetotail.
How does GOES forecast substorms?
What does this have to do with GOES? Well, this pair of satellites passes through the magnetotail and can measure how stretched out it is, or how far the slingshot is pulled back. It can also tell you when the tail dipolarizes and a substorm is occurring. First of all, these satellites are named GOES East and GOES West because they are geostationary satellites (meaning they stay above one spot on Earth and don’t drift) over the eastern and western coasts of the United States. When you reach the NOAA site where you can view the real-time GOES plots, if you click on the “7 day” tab, you will notice a wavy pattern. This shows the satellite moving in and out of the magnetotail over the course of a week. Since the satellites are geostationary and rotate with the Earth, but Earth’s magnetotail doesn’t rotate (it’s always on the nightside), over a 24-hour period, as the sun sets on the United States, the satellites in space move into the nightside magnetosphere and into the magnetotail. Since I am in Alaska, I always look at the blue line since it’s for GOES West which is closest to me. The horizontal axis of the plot is time in UT (universal time) and the vertical axis is the strength of the vertical component of the magnetic field as measured by the spacecraft. Don’t panic, let me explain.
How to read GOES plots
Fields (whether they are velocity, magnetic, electric, etc.) are actually vectors that have an x, y, and z component. This is because they are in 3-D space and you need to define a direction in which they are “going.” You can define any number of coordinate systems for this situation, but let's call the z-component the “up and down” direction. Then, you can think of the magnitude (size) of the z-component as telling you how “tall” the magnetic field. The more z-component you have, the more round the magnetotail is (because it will be taller) and the less you have, the more squished the magnetotail is (because it will be shorter). GOES is measuring this y-component, and as you can see by the plot, the further down the line goes, the smaller the field strength gets. As the line goes down, the values that tell us how tall the magnetotail is decrease - the tail is more stretched out.

This photo above shows the GSM coordinate system which fits with my analysis above. The z-component points through the north and south geomagnetic poles and extending that line towards the magnetotail, it describes its "height." The actual coordinate system used by the GOES magnetometers is EPN (eastward, parallel, normal).
Therefore, the more the blue line goes down, the more potential energy is being stored in the tail and the higher the likelihood that a burst of aurora will be coming. The further the line drops, the more intense that burst may be. But how can you tell when this burst happens? You need to watch for the dipolarizations.
Dipolarizations are seen in the GOES plots as sharp jumps. This means the magnetotail is releasing particles in quick bursts. If you see the line slowly increase after bottoming out, the particles are being released in a drizzle rather than a burst. When these particles hit our atmosphere, they cause aurora, but in order to achieve a substorm and the most impressive auroral displays, we want sharp jumps, not slow rises. On quiet nights, GOES will see one or two dipolarizations which will lead to substorms. On active nights, the line will often drop much further down and you may get three or four dipolarizations. On active nights, the aurora also tends to recover quicker after a substorm, meaning you will see the tail starting to stretch out (blue line going down) sooner after a dipolarization (sharp jump).

Screenshot of the GOES Magnetometer plots showing roughly 40 hours of measurements. Green arrows mark where dipolarizations occured as seen by the GOES-18 (West) satellite (blue line). Dipolarizations are seen as sudden vertical jumps in the plot.
Is there any way to forecast when these dipolarizations will happen? Not exactly, but if you know how to read solar wind data, changes in the orientation of the Bz can “shock” the magnetosphere, causing it to release particles. Imagine you are pulling back your slingshot and someone slaps your hand, startling you and causing you to fire the projectile. Same principle, but that slap could be a sudden switch from Bz south to north (negative to positive) or vice versa.
An Important Disclaimer
It should be said that even though GOES shows dipolarizations happening in real-time, because substorms generally initiate from one point in the auroral oval and spread out, if the time is either very prior to or later than magnetic midnight, you may see the substorm slightly after the dipolarization is registered by GOES. This is not a big issue and actually serves to give you some prior warning that a substorm is on its way. The opposite can happen, too, though. Because the satellite is geostationary, it is constantly moving through space and is not always perfectly in the magnetotail. Without going too deep into the details, this means that if a substorm occurs when the satellite is not perfectly in the tail, it may register a dipolarization a few minutes after the substorm has already occurred on Earth. This happens pretty frequently, and the timings are usually off by about 5-10 minutes for me in Alaska. But that doesn’t mean GOES is useless in these situations - if you see a massive aurora racing across the sky and then see a dipolarization in GOES, you can confidently say, “Oh, yes, that was the substorm we were waiting for!” Since substorms are usually followed by a 30-60 minute recovery period, you then know not to expect another massive auroral display for some time.
GOES - It's more than substorms...
Besides predicting substorms, how else can GOES be used? Well, knowing the “potential energy” of the aurora is a great way to forecast its behavior and interpret what it will do next. As you see the GOES plots dropping, that should tell you the auroras are “charging up.” During the early parts of the night, usually during this charging process, the aurora will look like a dull glow or quiet arc. To someone unfamiliar with GOES and the slingshot phenomenon, this would be discouraging. In fact, I have seen many chasers quit early after seeing the aurora at a standstill only to be burned when a massive substorm erupts at 2 or 3 am. In those situations, the aurora was just charging up longer than normal and needed some more time to release its energy. So if you see the GOES plots dropping but no aurora is actually visible in the sky, don’t worry. All the energy is building up in outer space and is getting ready to slingshot its way to Earth.
When is the aurora "done for the night?"
During extremely quiet nights where the aurora is confined to the northern skies (even in Fairbanks, Alaska), GOES can help you decide whether it's worth going out or not. On these nights, substorms are often seen around magnetic midnight which for Fairbanks, Alaska is around 2-3 am (depending on whether we are in daylight savings time or not). Sometimes, though, if it is VERY quiet, you will never see a substorm. If you see the GOES plot reach a saddle point and start to rise after a round bottoming, that’s a tell-tale sign that things are over and a substorm is not going to happen. In fact, without any substorm activity, the GOES plots would look like a perfect sinusoidal wave as the satellites move in and out of stretched magnetic field lines in the magnetotail.
You can also interpret the behavior of an aurora after a substorm based on how GOES responds. If a dipolarization is followed by an immediate downward turning in the plots, it means the aurora is gearing up for another substorm. This is rare but can happen on high-activity nights. Usually, though, substorm breakups are followed by a recovery period that lasts anywhere from 30 minutes to 2 hours. If you see a sharp uptick (dipolarization) that evolves into a slow but steady increase, it means the aurora is in recovery. Ideally, that recovery period ends with the aurora charging up again (plot going down), but sometimes, you only will get one substorm in a night.
It also should be said that seeing a general upward trend as the night comes to a close, especially if you are far away from the satellite's geostationary position, is to be expected. This is the characteristic wavy pattern that dominates the overall plot. In general, though, if you see the plot dropping after a dipolarization, that is a good sign.

In this screenshot of the GOES magnetometers, we follow the blue line (GOES WEST) and observe three periods of magnetotail loading/charging and three dipolarizations. After the first dipolarization, the plot flatlines then moves downward, indicating charging. After the second dipolarization, the plot moves back down, although normally, we would expect some recovery. This night had strong geomagnetic activity which meant there could be multiple substorms in quick succession. After the third dipolarization, the satellite was moving out of the tail as well as the aurora recovering, so the line increased.

This is a hard plot to analyze. We see charging followed by a dipolarization (to be expected) which leads to a gradual re-charging of the aurora (magnetotail elongating). However, instead of a dipolarization, the plot slowly increases after bottoming out. This is probably because the satellite is moving out of the tail region and into more dipolar field lines as well as there being a lower level of loading into the magnetotail. Remember that the general trend of the graph will be a sinusoidal wave without any auroral activity. Loading and releasing of particles will perturb this trendline.
Calibrating your standards - what is a "good" aurora?
Besides monitoring GOES in real-time, I also look at long-term trends with the 7-day zoom window on the plot webpage. This is especially helpful if you have been aurora chasing for multiple days in a row. By that point, you have a standard for what you consider to be a “good show,” and you can go back and see what GOES saw that night and compare it to the current night’s activity. For example, if you saw what in your mind was a great auroral display but GOES only recorded a small dipolarization and the plots never reached very low values, chances are that your standards are low and you still haven’t seen a proper high-latitude display. This is totally expected for travelers who are seeing the aurora for the first time, but for me who has seen the aurora hundreds of times, I have made a note of the GOES plots during the greatest auroral displays and compare those readings to any given night’s aurora. If I see what looks like a repeat of those great nights happening before my eyes, it lets me know that night might be worth staying out late for. Conversely, if I see a weak signature in GOES (plot doesn’t decrease much and slow, steady rise close to or after magnetic midnight), I will call the chase early knowing that whatever happens will never compare to auroral displays I have seen in the past. While you likely don’t have hundreds of nights of aurora chasing under your belt, a week’s worth of activity is at least some context that will tell you how your current night is shaping up relative to past displays.

The 7-day view of GOES can be useful context for how geomagnetic activity for a given night compares to previous activity. For example, the orange-shaded night saw very weak auroral activity due to the plots not reaching very low values and no observed dipolarizations. The night shaded green saw more intense activity with three dipolarizations.
Don't put all your eggs in one basket...
While the GOES magnetometers are great tools, they are only one piece in the puzzle when it comes to accurately predicting the aurora. Reading solar wind data, looking at ground magnetometers, and tracking other indices like the AE index, Dst, and Hp 30/Hp 60 should all be done alongside GOES so that you have a complete context of the geomagnetic environment and auroral activity. All these tools can be overwhelming, but the important thing is understanding their strengths and weaknesses. While it may be obvious what those are for the GOES magnetometers, let me make it explicitly clear. The biggest weakness of this tool is that it is most useful for aurora chasers in North America. European friends may be able to derive some small benefits, but that’s outside the scope of this blog post. The other weakness of the magnetometers is that sometimes the dipolarizations don’t exactly line up with observed substorms on the ground. Usually, the signatures in the plots are within 15 minutes of observed activity, but it’s not a magic tool that will be accurate within minutes 100% of the time. The benefits of GOES are huge, though. With this tool, you are able to measure the potential energy of the aurora and gauge micro and macro trends, i.e., whether the aurora is strengthening or weakening and whether a substorm has taken place. This boils down to making a better call of when the right time is to go home and call it a night. The worst feeling as an aurora chaser is misjudging a weak-looking aurora as an aurora with no potential, going to bed early, and missing a huge explosion of activity while you’re catching some Zzz’s. After you learn how to use GOES, you should know when these bursts of activities can happen and also when the aurora is likely done for the night meaning it’s “safe” to sleep.
I use the GOES magnetometers every night when I’m out aurora chasing, and when I’m out in the field, it’s the main thing I pay attention to. It’s incredibly powerful and underutilized, but I hope that after reading this blog post you have a better understanding of how this tool could be of benefit.
If you enjoyed this piece, feel free to subscribe to my e-mail list so you never miss a future blog post. When you sign up, you will also receive a link to download my most popular e-book “A Beginner’s Guide to Aurora Chasing” for FREE!
With that, thanks for spending time reading this article. I hope you have a great day or night, and I wish you clear skies and plenty of aurora on your next chase. Thanks!